Zombification Risk Mapping
A tutorial on how to build a zombification risk map per IRIS in France using open data from OSM and INSEE.
Project Description
This code is a tutorial on how to build a zombification risk map scored per IRIS in France.
The higher the score, the more dangerous the IRIS:
- The higher the number of cemeteries in the IRIS & the closer to one (×0.35)
- The closer the IRIS is to an airport (×0.20)
- The higher the population density (×0.15)
- The higher the ratio of people aged 75 and above (×0.10)
- The higher the number of disabled people receiving AAH (×0.10)
- The closer to a weapon shop (×0.10)
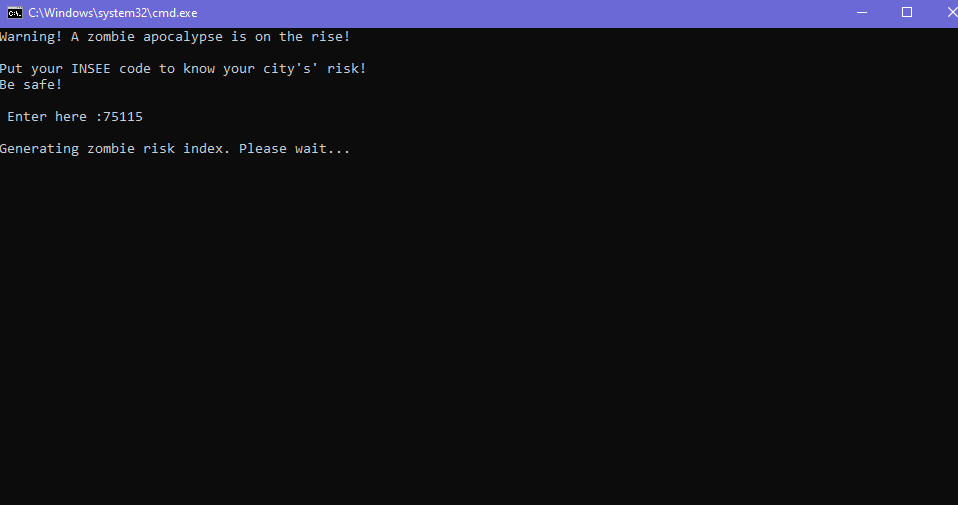
All you need to do is insert the INSEE code of any commune in France and the script will generate a risk map automatically.
Datasets used
| Dataset | Source |
|---|---|
| Cemetery points & polygons | BDTOPO 2026 |
| Population density | INSEE (base IRIS 2022) |
| 75+ year old ratio | INSEE (base IRIS 2022) |
| Disabled people (AAH recipients) | CAF / INSEE 2021 |
| Airfields & airports | BDTOPO 2026 |
| Weapon shops | OpenStreetMap (OSM) |
| IRIS contours | IGN CONTOURS-IRIS 2022 |
Libraries used
- geopandas
- pandas
- numpy
- folium
- branca
- scikit-learn
Preview